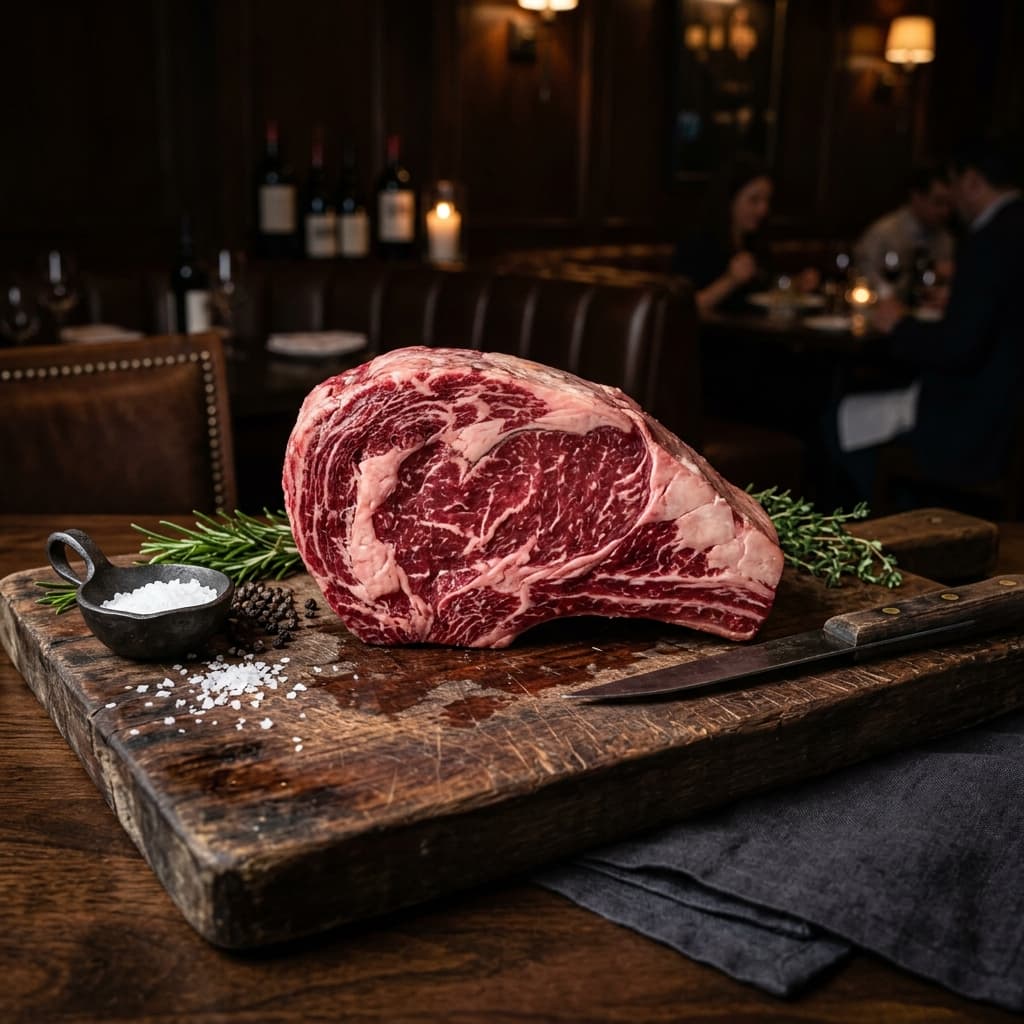
American beef grading is a standardized system developed and administered by the United States Department of Agriculture (USDA). It evaluates beef based on quality and yield, helping producers, distributors, and consumers understand the expected eating experience and value of the meat.
1. Overview of the Grading System
Beef grading in the U.S. consists of two primary classifications:
A. Quality Grades
These indicate tenderness, juiciness, and flavor, primarily based on:
- Marbling (intramuscular fat)
- Maturity (age of the animal)
B. Yield Grades
These measure the amount of usable lean meat from a carcass.
2. USDA Quality Grades
Main Grades for Consumers
| Grade | Marbling Level | Typical Use |
|---|---|---|
| Prime | Abundant | Fine dining, steakhouses |
| Choice | Moderate | Retail, restaurants |
| Select | Slight | Leaner cuts, budget-conscious buyers |
Secondary Grades (Less Common)
| Grade | Characteristics |
|---|---|
| Standard | Minimal marbling, often ungraded retail |
| Commercial | Older cattle, lower tenderness |
| Utility | Processed foods |
| Cutter | Ground or processed products |
| Canner | Lowest quality, canned goods |
3. Marbling Scale Visualization
Below is a simplified chart illustrating marbling levels across top grades:
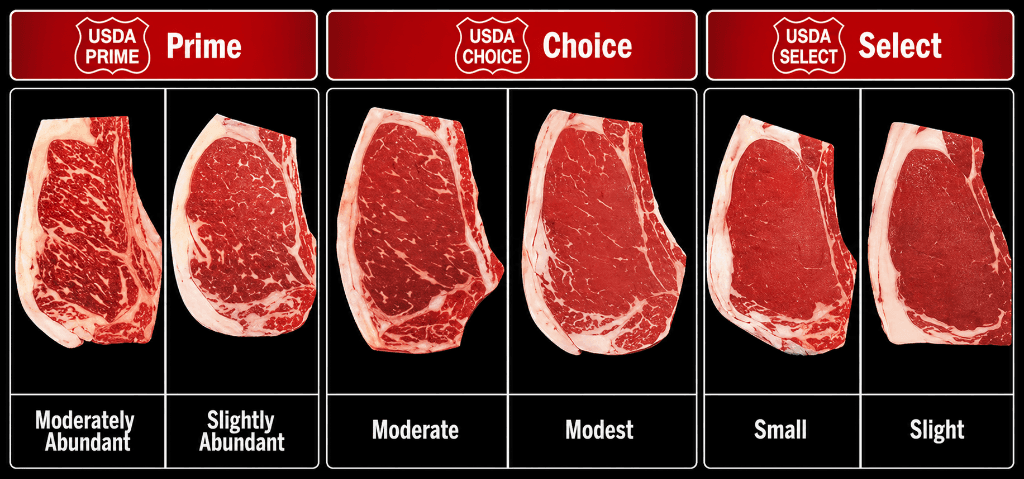
Higher marbling = more intramuscular fat = better flavor and tenderness.
4. Maturity Classification
Beef maturity affects texture and flavor. USDA assigns maturity levels:
| Maturity Group | Approximate Age | Meat Characteristics |
|---|---|---|
| A | 9–30 months | Most tender, bright color |
| B | 30–42 months | Slightly less tender |
| C–E | Older cattle | Tougher, darker meat |
Most retail beef is A maturity.
5. USDA Yield Grades
Yield grades estimate the percentage of boneless, closely trimmed retail cuts.
| Yield Grade | Lean Meat Yield | Interpretation |
|---|---|---|
| 1 | Highest | Very lean, efficient |
| 2 | High | Above average |
| 3 | Average | Industry standard |
| 4 | Low | Excess fat |
| 5 | Lowest | Very fatty carcass |
6. Yield Grade Formula (Simplified)
Yield grade is calculated using:
- External fat thickness
- Ribeye area
- Hot carcass weight
- Internal fat (KPH fat)
Conceptual Representation:
7. Relationship Between Quality and Yield
Quality and yield grades do not always correlate:
8. Beef Grading Process
- Slaughter & Carcass Splitting
- Inspection at Ribeye (12th rib)
- Evaluation of:
- Marbling
- Color and texture
- Fat distribution
- Assignment of Quality & Yield Grades
- Stamping with USDA shield
9. USDA Shield and Labeling
- The USDA grade shield is optional but widely used
- Only USDA graders can assign official grades
- Labels may include:
- “USDA Prime”
- “USDA Choice”
- “Certified Angus Beef” (brand, not a grade)
10. Market Distribution
Approximate U.S. beef grading distribution:
11. Practical Implications
For Consumers
- Prime: best for grilling, premium cuts
- Choice: versatile, good balance
- Select: best with marinades or slow cooking
For Producers
- Higher grades = higher profitability
- Feeding strategies influence marbling
For Chefs
Grade selection impacts:
- Cooking method
- Menu pricing
- Customer satisfaction
12. Key Takeaways
- Quality grade = eating experience
- Yield grade = efficiency and value
- Marbling is the most critical factor
- Prime beef is rare and premium
- Most beef sold is Choice